elephant.signal_processing.hilbert
- elephant.signal_processing.hilbert(signal, padding='nextpow')[source]
Apply a Hilbert transform to a neo.AnalogSignal object in order to obtain its (complex) analytic signal.
The time series of the instantaneous angle and amplitude can be obtained as the angle (np.angle function) and absolute value (np.abs function) of the complex analytic signal, respectively.
By default, the function will zero-pad the signal to a length corresponding to the next higher power of 2. This will provide higher computational efficiency at the expense of memory. In addition, this circumvents a situation where, for some specific choices of the length of the input, scipy.signal.hilbert function will not terminate.
- Parameters:
- signalneo.AnalogSignal
Signal(s) to transform.
- paddingint, {‘none’, ‘nextpow’}, or None, optional
Defines whether the signal is zero-padded. The padding argument corresponds to N in scipy.signal.hilbert(signal, N=padding) function. If ‘none’ or None, no padding. If ‘nextpow’, zero-pad to the next length that is a power of 2. If it is an int, directly specify the length to zero-pad to (indicates the number of Fourier components). Default: ‘nextpow’
- Returns:
- neo.AnalogSignal
Contains the complex analytic signal(s) corresponding to the input signal. The unit of the returned neo.AnalogSignal is dimensionless.
- Raises:
- ValueError:
If padding is not an integer or neither ‘nextpow’ nor ‘none’ (None).
Examples
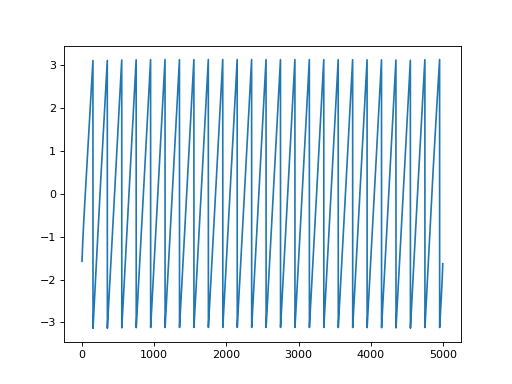
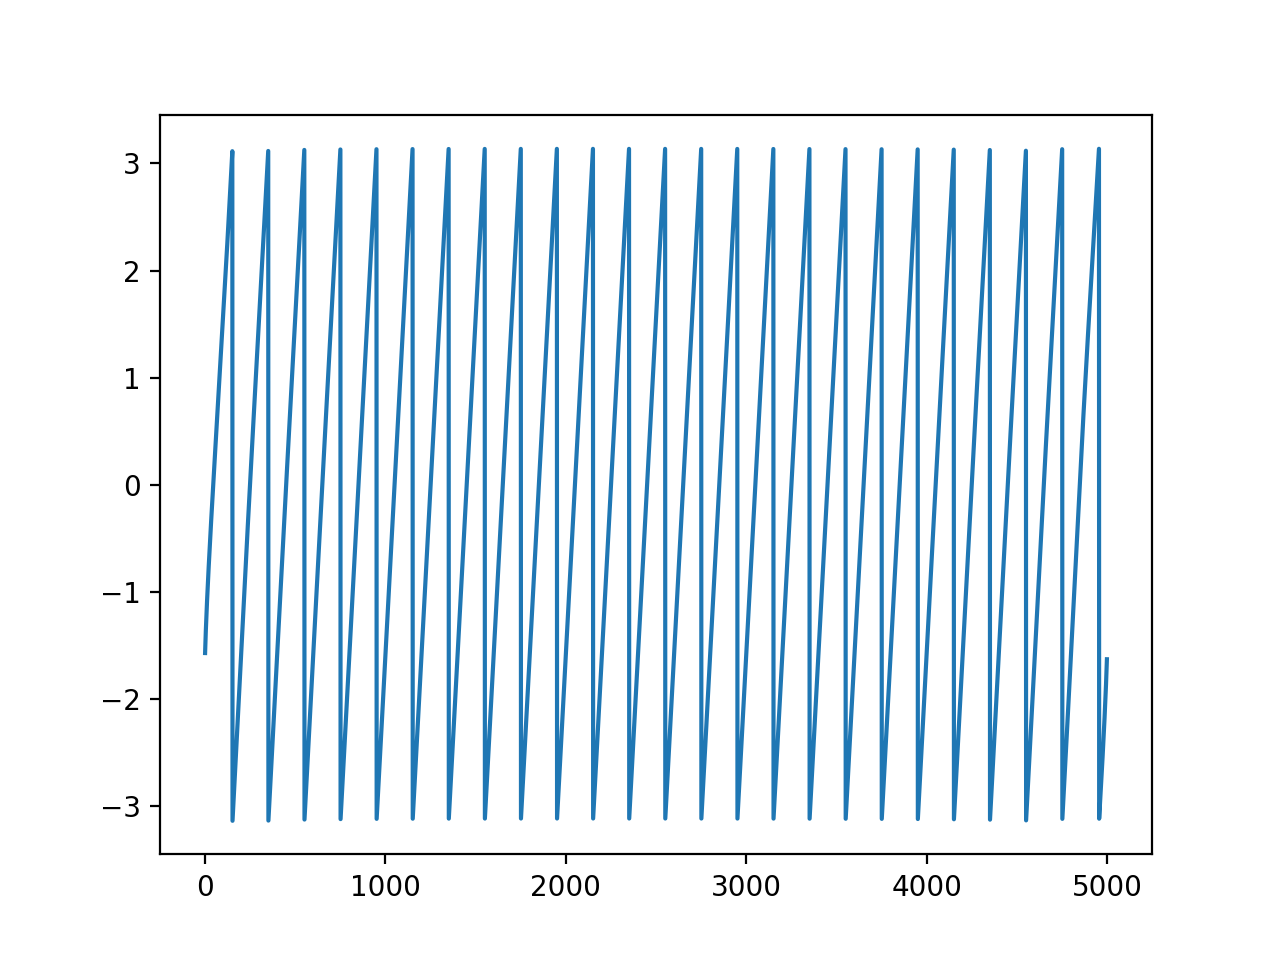
Create a sine signal at 5 Hz with increasing amplitude and calculate the instantaneous phases:
import neo
import numpy as np
import quantities as pq
import matplotlib.pyplot as plt
from elephant.signal_processing import hilbert
t = np.arange(0, 5000) * pq.ms
f = 5. * pq.Hz
a = neo.AnalogSignal(
      np.array(
          (1 + t.magnitude / t[-1].magnitude) * np.sin(
              2. * np.pi * f * t.rescale(pq.s))).reshape(
                  (-1,1)) * pq.mV,
      t_start=0*pq.s,
      sampling_rate=1000*pq.Hz)

analytic_signal = hilbert(a, padding='nextpow')
angles = np.angle(analytic_signal)
amplitudes = np.abs(analytic_signal)
plt.plot(t, angles)
(
Source code,png,hires.png,pdf)